How To Develop Product Comparison Charts For Sales With ChatGPT

Product comparison charts serve as a powerful instrument for sales teams, allowing them to highlight the distinct features and advantages of various products. Their effectiveness lies in aiding potential customers in making well-informed decisions by presenting a visually clear representation of the similarities and differences among products. In this blog, we delve into the utilization of ChatGPT in the creation of product comparison charts, emphasizing the blend of informativeness and engagement.
Introducing The Things
What’re Product Comparison Charts
Product comparison charts are like roadmaps, guiding consumers through the vast landscape of choices. These charts provide a concise visual overview of the similarities and differences between various products, enabling individuals to assess their options at a glance.
Product comparison charts are the compass that guides buyers through the often overwhelming journey of choosing the right product for their needs.
Role of Product Comparison Charts in Sales
Product comparison charts play a pivotal role in the realm of sales, serving as indispensable tools for both businesses and consumers. These charts act as visual storytellers, weaving narratives about the unique features and benefits of various products.
For businesses, they become persuasive instruments, enabling them to showcase their offerings in a clear and compelling manner. Product comparison charts bridge the communication gap between sellers and buyers, fostering transparency, informed choices, and ultimately, successful transactions.
Steps For Developing Product Comparison Charts
Step 1: Identify the Products to Compare
The first step in this journey is pinpointing the products that will grace your comparison chart. This initial stage involves a thoughtful selection process, where we pinpoint the products that will take center stage in our comparison narrative.
Understanding our target audience, their needs, and the features that matter most to them. This step lays the foundation for a meaningful and relevant comparison, ensuring that the ensuing chart resonates with our readers and aids them in making informed decisions.
Step 2: Gather Product Information
Once you have identified the products, gather all the necessary information about each product. This calls for a comprehensive gathering of essential information, encompassing features, specifications, pricing, customer reviews, and any other pertinent details.
By presenting it in a clear and structured manner, we ensure that our audience can seamlessly compare the products, making the decision-making process both informed and effortless. It ensuring that our audience has access to a well-rounded understanding of what each product brings to the table.
Step 3: Define the Comparison Criteria
Before creating the comparison chart, it’s important to define the criteria on which the products will be compared. These criteria can include price, quality, performance, customer ratings, warranty, and any other factors that are important to your target audience. This step is fundamental to fostering a fair and accurate comparison, empowering our audience with the information they need to make well-informed decisions.
Step 4: Choose the Right Chart Format
There are various chart formats you can choose from to present your product comparison data. Some popular options include bar charts, line charts, radar charts, and tables. Your decision should be guided by a careful consideration of the nature of your data and an understanding of your audience’s preferences.
Each format has its unique strengths, and the goal is to select one that seamlessly communicates the comparison information you aim to convey.
Step 5: Use ChatGPT to Generate Comparison Content
ChatGPT can be a precious tool in generating the content for your product comparison map. By furnishing applicable information about each product, ChatGPT can help in creating engaging and instructional descriptions. You can input the product details and ask ChatGPT to induce terse and accurate content for each point or criterion you want to compare.
By inputting relevant product details, we can leverage ChatGPT’s capabilities to generate concise and accurate content for each feature or criterion we wish to compare.
Step 6: Organize and Design the Comparison Chart
Once you have the content generated by ChatGPT, organize it in a logical and easy- to- understand manner. Divide the map into sections grounded on the defined comparison criteria. Use headlines and heads to easily label each section and make it visually appealing. insure that the map is easy to read and understand at a regard.
Creating a chart that flows logically, making it easy for your audience to navigate and understand. This step is the artistry of presentation, where the goal is not only to inform but to create an aesthetically pleasing and user-friendly comparison chart.
Step 7: Add Visual Elements
To enhance the visual appeal of your product comparison map, consider adding applicable images or icons. Visual rudiments can help druggies snappily identify and separate between products. still, be aware of not overcrowding the map with too numerous illustrations, as it may distract from the main purpose of the comparison.
The strategic incorporation of relevant images or icons adds a layer of richness to the chart, aiding users in swiftly identifying and differentiating between products. This step is the visual embellishment, where each image or icon becomes a deliberate brushstroke, contributing to the overall aesthetic appeal and user experience of our comparison chart.
Step 8: Review and Update Regularly
Product information and client preferences can change over time. It’s pivotal to review and modernize your product comparison map regularly to insure it remains accurate and applicable. Keep track of any updates or changes in the products you’re comparing and make the necessary adaptations to your map. Our chart remains a reliable and up-to-date resource for our audience.
This step is akin to the steady heartbeat of our chart, keeping it in sync with the dynamic nature of the market and ensuring it continues to serve as a trustworthy guide for potential customers.
Prompts For Developing Product Comparison Charts
Prompt 1
“Hi ChatGPT! I would greatly appreciate your assistance in generating a product comparison chart for [Product A] and [Product B]. My goal is to create a comprehensive overview of the two products, highlighting the most significant features, benefits, and pricing information. This way, customers can make an informed decision when deciding which product to purchase. I understand that comparing products can be a challenging task, so I’m hoping that you can provide me with the necessary insights to make this process easier.”
Prompt 2
“Hi ChatGPT! As our business expands, we are introducing a new product line that includes [Product A], [Product B], and [Product C]. Creating a product comparison chart for this line is essential to help customers understand the differences between each product. I would appreciate it if you could provide me with insights on the essential features and benefits to highlight for each product, along with pricing information. With your help, I hope to create an informative and easy-to-understand comparison chart that our customers will appreciate.”
Prompt 3
“Hi ChatGPT! I’m hoping that you can help me create a product listing for [Product Name]. I want to make sure that the listing accurately describes the product’s features and benefits while highlighting what sets it apart from other similar products in the market. This way, customers will have a clear understanding of what the product has to offer and why it’s unique. I understand that this can be a challenging task, so I’m hoping that you can use your expertise to create a compelling product description that will help our product stand out.”
Prompt 4
“Hi ChatGPT! As we prepare to launch our new product line, we want to create a comparison chart that emphasizes the unique features and benefits of each product. This will help us understand how our products compare to similar products in the market, and what we can do to improve our offerings. I would appreciate it if you could provide me with data analysis and customer feedback insights to help identify crucial comparison areas and highlight product strengths and weaknesses. With your help, we hope to create an informative and engaging comparison chart that will help our customers make informed decisions.”
Prompt 5
“Hi ChatGPT! Our business is considering adding a new product to our line, and we need to create a comparison chart to assess its potential against existing products. As such, we need your help to identify the most crucial features and benefits to include in the chart, along with pricing and competitive analysis. We want to make sure that we are presenting accurate and relevant information to our customers, so they can make informed decisions. With your assistance, we hope to create a comprehensive comparison chart that will help us evaluate the potential of our new product.”
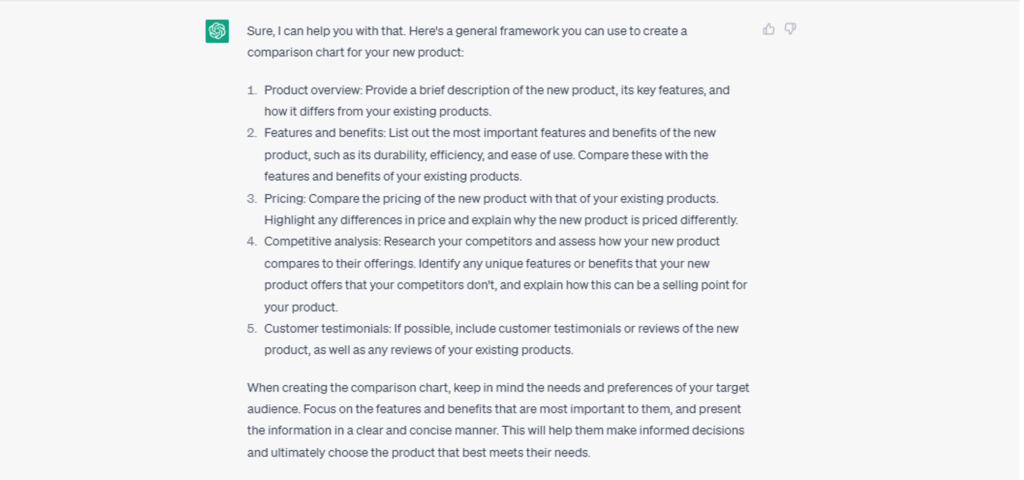
Results

Read Also: Create FAQs with AI.
Tips For Developing Product Comparison Charts
Finnal Words
Developing product comparison maps for deals with the help of ChatGPT can streamline the process and produce instructional and visually appealing maps. By following the way outlined in this composition, you can produce effective product comparison maps that help implicit guests in making informed purchasing opinions. Flash back to regularly modernize the maps to reflect any changes in the products or request trends.
Happy charting!
For more such prompts you can come into our array of prompts to enhance your work.


