How To Create Infographics With ChatGPT

Infographics have become a popular way to present information in a visually appealing and engaging manner. They can effectively convey complex data, statistics, and concepts in a concise and easy-to-understand format. ChatGPT, an advanced language model, can be a valuable tool in creating infographics that effectively communicate your message. In this article, we will guide you through the process of using ChatGPT to create stunning infographics.
Introduction To Infographics
Infographics serve as powerful tools for communicating complex ideas by transforming data into accessible and engaging visuals. In a society inundated with information, infographics offer a refreshing approach to convey messages effectively. These graphic representations go beyond mere illustrations; they are a fusion of design and data, simplifying intricate concepts and making them digestible for a diverse audience.
These graphical representations transcend the boundaries of traditional data presentation, offering an innovative approach to conveying complex ideas. In a world inundated with information, infographics emerge as a beacon of clarity, distilling intricate concepts into visually digestible forms
Steps For Creating Infographics
Step 1: Defining Your Objective
Before diving into the creation process, it’s important to clearly define your objective for the infographic. Determine the key message you want to convey and the target audience you want to reach. Having a clear objective will help you stay focused throughout the creation process. Begin by identifying the key message or information you want to convey. Whether it’s presenting statistical data, explaining a complex concept, or telling a story, a well-defined objective guides the entire creative process.
Step 2: Gathering Data and Content
Next, gather the relevant data and content that you want to include in your infographic. This can be in the form of statistics, facts, or any other information that supports your objective. Make sure to gather reliable and accurate data from credible sources. ChatGPT can assist you in finding relevant information and generating content ideas.
Step 3: Outlining the Infographic
Once you have your data and content, it’s time to outline the structure of your infographic. Determine the main sections and subtopics that will be included. This will help you organize the information in a logical and visually appealing manner. ChatGPT can provide suggestions for structuring your infographic and help you create a cohesive flow of information.
Step 4: Designing the Infographic
Design plays a crucial role in the effectiveness of an infographic. While ChatGPT is primarily a language model, it can still provide guidance on design elements. Describe your desired visual style and layout to ChatGPT, and it can offer suggestions on color schemes, fonts, and overall design aesthetics. Remember to keep the design clean, uncluttered, and visually engaging.
Step 5: Writing the Content
With the outline and design in place, it’s time to write the content for your infographic. ChatGPT can assist you in generating concise and impactful text that effectively communicates your message. Provide ChatGPT with the key points you want to include in each section, and it can help you craft compelling and informative content.
Step 6: Visualizing the Data
Infographics are all about visualizing data in an easily understandable format. ChatGPT can help you transform raw data into visually appealing charts, graphs, and illustrations. Describe the type of visualizations you want to include, and ChatGPT can provide suggestions on the best way to represent your data visually.
Step 7: Review and Refine
After completing the initial draft, it’s important to review and refine your infographic. Check for any inconsistencies, errors, or areas that need improvement. ChatGPT can assist you in proofreading and suggesting edits to enhance the overall quality of your infographic.
Step 8: Sharing and Promoting
Once you are satisfied with your infographic, it’s time to share and promote it. Consider the platforms where your target audience is most active and share your infographic accordingly. Utilize social media, blogs, and other relevant channels to reach a wider audience. ChatGPT can provide suggestions on effective promotion strategies to maximize the visibility of your infographic.
Integrating ChatGPT-Generated Content
Generating Text with ChatGPT
ChatGPT, a cutting-edge language model, acts as a virtual writing assistant, providing valuable insights, ideas, and even entire paragraphs. It starts with inputting a prompt or a question, and ChatGPT responds with coherent and contextually relevant text. This revolutionary approach to content generation opens up new possibilities for brainstorming, overcoming writer’s block, and enhancing the overall efficiency of the creative process.
Refining and Editing
Once the initial content is generated with ChatGPT, the crucial phase of refining and editing takes center stage in the content creation process. This human touch is indispensable for ensuring the coherence, accuracy, and tone of the text align with the intended message. It involves a meticulous review of the AI-generated content, identifying areas that need clarification, adjustment, or enhancement. Refining and editing play a pivotal role in tailoring the information to suit the audience and maintaining a consistent voice throughout the material.
Tips for Generating High- Quality Infographics with ChatGPT
Understand your followership Before creating an infographic, it’s essential to know who your target followership is. Consider their interests, preferences, and the type of information they’re looking for.
Identify your objective: Determine the purpose of your infographic. Having a clear ideal will help you produce a focused and poignant design.
Organize your happy: Break down your information into sections or crucial points. Use headlines, heads, and pellet points to produce a logical inflow and make it easier for compendiums to follow.
Produce a visually charming design: Infographics should be visually appealing to capture and retain the anthology’s attention. Use colors, sources, and images that round your content and reflect your brand’s style.
Include data and statistics: Incorporate applicable data and statistics to support your information. fantasize the data using graphs, maps, or icons to make it more accessible.
Proofread and edit: Before finishing your infographic, proofread the content for any grammatical crimes or inconsistencies. Make necessary edits to ameliorate the overall quality.
By following these tips, you can produce high- quality infographics that effectively communicate your communication and engage your followership. Flash back to always keep your target followership in mind and strive for a visually charming design that complements your content.
Prompts For Creating Infographics
Prompt 1
“Hello, ChatGPT. I would like for ChatGPT to generate an infographic template that showcases [STATISTICS/FACTS] about [TOPIC]. It needs to be visually appealing and easy to understand, with a modern design that incorporates [COLOR SCHEME/LOGO/BRANDING]. Can you please provide me with a design that is easy to customize to fit my needs and that includes all the necessary components to create a high-quality and informative infographic? Thank you.”
Prompt 2
“Hello, ChatGPT. I am in need of an infographic template that highlights the key features and benefits of [TWO OR MORE TOPICS/PRODUCTS/SERVICES]. The design should include clear graphics and minimal text, while being visually engaging and easy to follow. Can you please create a template that I can easily customize to fit my needs and that includes all the necessary components to create a high-quality and informative infographic? Thank you.”
Prompt 3
“Hello, ChatGPT. I am looking for an infographic template that explains [PROCESS/TECHNOLOGY/CONCEPT] in a way that is easy for a non-technical audience to understand. The design must have clear and concise visuals that illustrate each step, and use a color scheme that matches our brand guidelines. Can you please create a template that I can easily customize to fit my needs and that includes all the necessary components to create a high-quality and informative infographic? Thank you.”
Prompt 4
“Hello, ChatGPT. Can you please design an infographic template that provides an overview of the impact of [EVENT/TREND/ISSUE] on [INDUSTRY/COMMUNITY]? It should highlight key statistics and trends and be visually engaging and easy to read. Can you please create a template that I can easily customize to fit my needs and that includes all the necessary components to create a high-quality and informative infographic? Thank you.”
Prompt 5
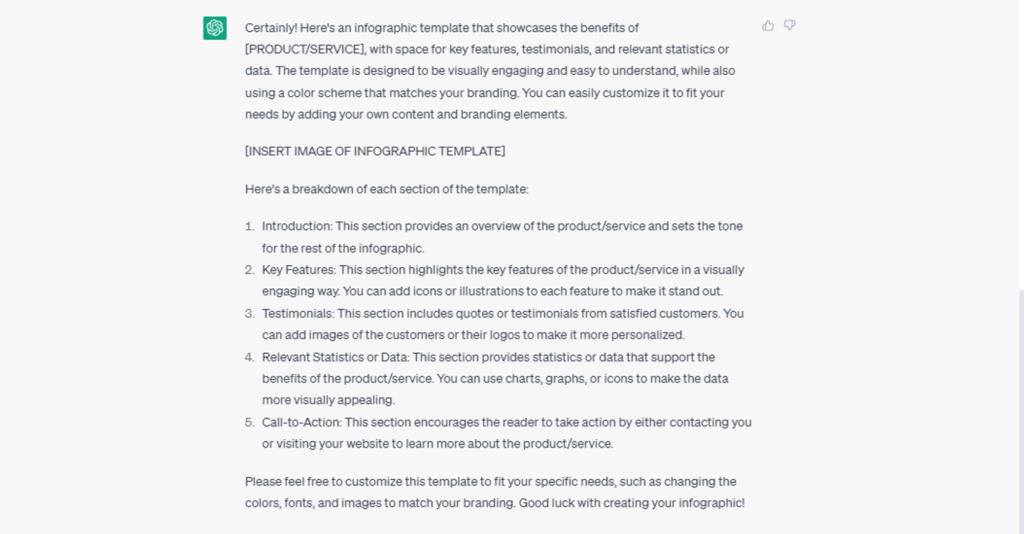
“Hello, ChatGPT. I need an infographic template that showcases the benefits of [PRODUCT/SERVICE]. It must include key features, testimonials, and relevant statistics or data. Please make sure it is visually engaging and easy to understand while using a color scheme that matches our branding. Can you please create a template that I can easily customize to fit my needs and that includes all the necessary components to create a high-quality and informative infographic? Thank you.”
Result
Read More: Learn Writing White Papers With ChatGPT.
Tips For Creating Infographics
Final Words
Creating infographics with ChatGPT can streamline the process and help you create visually stunning and informative content. By leveraging the power of ChatGPT, you can effectively communicate your message, engage your audience, and make complex information more accessible. Follow the steps outlined in this article, and unleash your creativity to create compelling infographics that leave a lasting impact.
For more such information you can come to our array of prompts for any work.
